Monitoring 

Wheel-rail monitoring for predictive maintenance 

Safe and reliable rail vehicles with the monitoring system and service

Despite growing awareness of predictive maintenance as a means of reducing cost and improving reliability in the rail industry, its use is still limited. Operators can struggle to get accurate and useful data from their infrastructure and rolling stock in time to draw the right conclusions and plan corrective actions. Noise and vibration monitoring can close this gap by allowing data collection on a daily basis which enables the early identification of trends and emerging issues. Field data indicates that the information derived from this type of monitoring is particularly useful to optimise an operator’s grinding and noise management programmes leading to cost savings and enhancing their reputation. 

Life-cycle-cost (LCC) considerations need a consistent monitoring.

– Ongoing documentation of the current status to check the efficiency of implemented maintenance measures
– Information at your fingertips for internal and external validation
– Long and mid-term optimization for LCC considerations
– Independence of measurements, increase internal Know-How
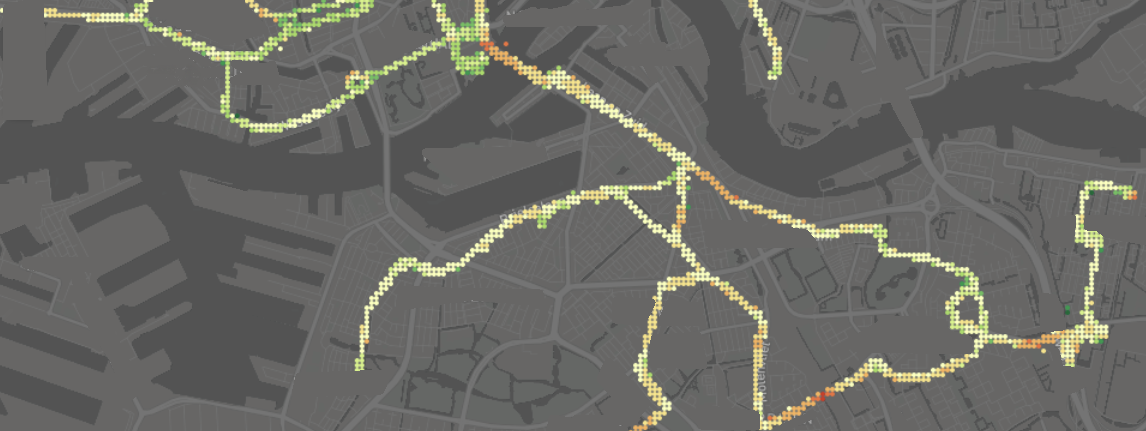
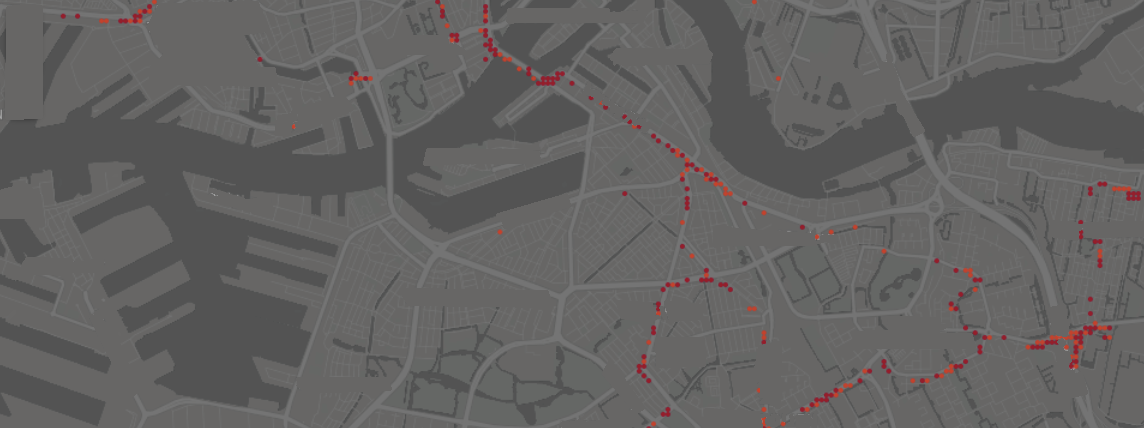
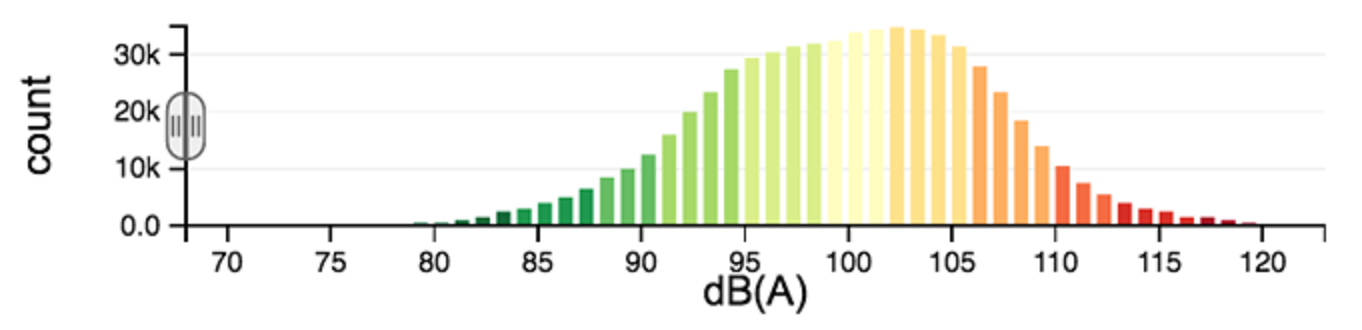
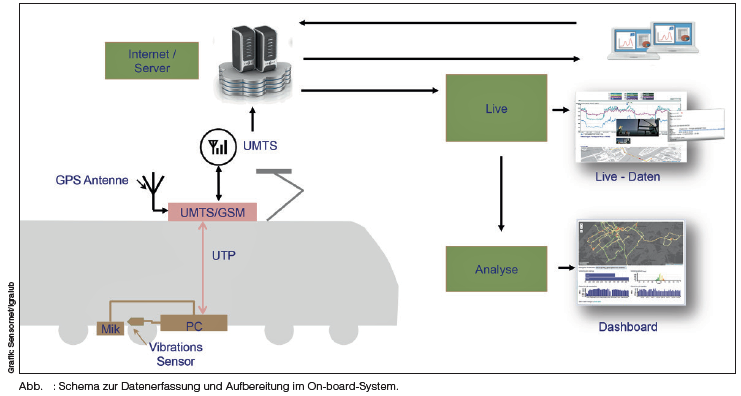
– Today’s technology allows for constant infrastructure and vehicle driven data collection and analysis.

Fleet Monitoring

Setup at neuralgic network knots, wayside monitoring units primarily collect sound and vibrational data of passing vehicles.

Infrastructure Monitoring

Train borne monitoring units installed in regular vehicles record noise, vibrational data and pantograph impacts. A few regular vehicles collect much more statistically robust data in considerable shorter time than dedicated measuring vehicles can do.

Überw-syst
Monitor

Stationary unit to record data from passing vehicles

Unit installed on bogie

Infra dashboard – collected data from reference vehicles

Average network noise and vibration compared to filtered hot spot regions

– A few clicks to filter for problematic spots or regions of the network with suspicious characteristics.
– Comparisons between months helps to track the efficiency of implemented measures.

Fleet dashboard – parameters by vehicle

Abbildung von Trends einzelner Fahrzeuge und Darstellung der Fahrzeuge in Bezug auf die ganze Flotte
– A fast way to spot vehicles which are above average.
– Sound files of all vehicles passing the location.